


With its “Visual Die Protection” (VDP), Schuler has developed an image-based monitoring system for dies that helps avoid expensive repairs, downtimes, or even total failures. It has already proven its functional capability multiples times, both on the progressive and transfer presses as well as on the press lines of customers. Precisely how the solution in Schuler’s “Digital Suite” works was recently demonstrated by product manager Christoph Pölzl in an online seminar with around 60 participants.
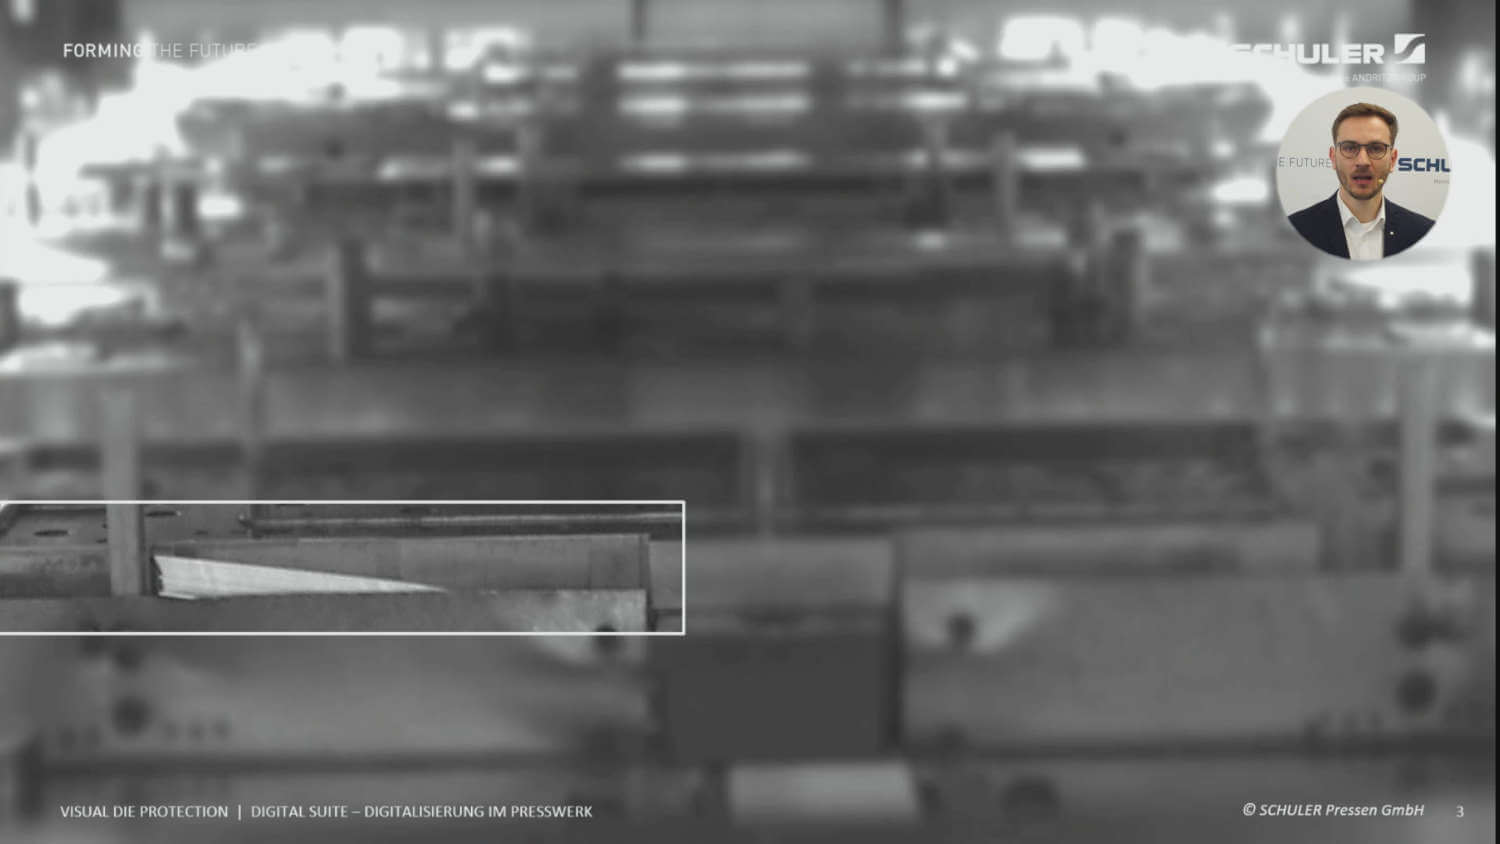
While depositing a part in a transfer press during production, a gripper breaks off and remains lying on the lower die: This is the initial situation that Pölzl outlined at the beginning of the seminar. “Using the cameras we installed in the die space, we now have the ability to detect the gripper and stop the system so no damage occurs”, he explains and emphasizes: “This is not a fictitious example, but exactly what happened to one user.” A further example is an incorrectly inserted blank: “In this case, too, we would stop the system and indicate to the operator where he needs to look for the fault so he can eliminate it as quickly as possible and restart his production.”
Another possible scenario is blanking scrap that has jammed and built up in a scrap chute – a problem that can be solved in the same manner. According to Pölzl, the aim is not only to avoid the cost of repairs, but also unplanned system downtimes, additional die changes, and further production planning expenses. The VDP system also minimizes the risk of ending up in delivery bottlenecks.
Damages Right Through to Fracturing of the Cast Iron Body Are Possible
One of the biggest damages the system has been able to prevent to date relates to a column guide that detached from the upper die: “If the die were to close now and move down onto the hardened element, this could lead to fracturing of the cast iron body of the press,” describes Pölzl regarding the possible consequences. VDP also stopped the system in time in this case: “The die maker was able to reattach the column guide.”
The system can even identify cracks in the part measuring only a few millimeters. The standard scope of delivery includes two cameras, one of which is normally mounted on the feed side and the other on the exit side to monitor each half of the die respectively. In the case of an especially long press bed, it is also possible to install a further device with a zoom lens to cover the middle area: “Up to six cameras in total can be connected in order to monitor all forming stages”, says Pölzl.
Operation at an Output of 35 Strokes per Minute
The system can be operated up to an output of 35 strokes per minute without problems, and one customer of Schuler is even operating their system at just over 50. “We do reach our limits at some point, however”, concedes the product manager. In general it can be said: “The bigger the stroke height, the better the view.” In most cases it is best to take a picture right at the moment when the transfer has deposited the part and the die is starting to close – that is, at about a crank angle of 70 degrees: “In the event of a critical deviation, we can then initiate an immediate stop.” It is worthwhile taking another look at approximately 290 degrees when the die is opening again and the transfer is grasping the part. In this case, however, it is more about the quality of the product: “A stop at cycle end or even just a warning message would be sufficient at this point.”
VDP can be set up in less than 24 hours, even on systems from other manufacturers. A trial installation for a day of testing is also possible. The system comprises an industrial PC in a mini control cabinet, an operator panel, and camera consoles with a protective housing to protect them from mechanical damage and contamination such as oil mist. “Users have reported that the reduction in damage to the die, and the increase in availability as well as delivery performance have contributed to savings of up to 120 000 euros per year and system,” reports Pölzl.
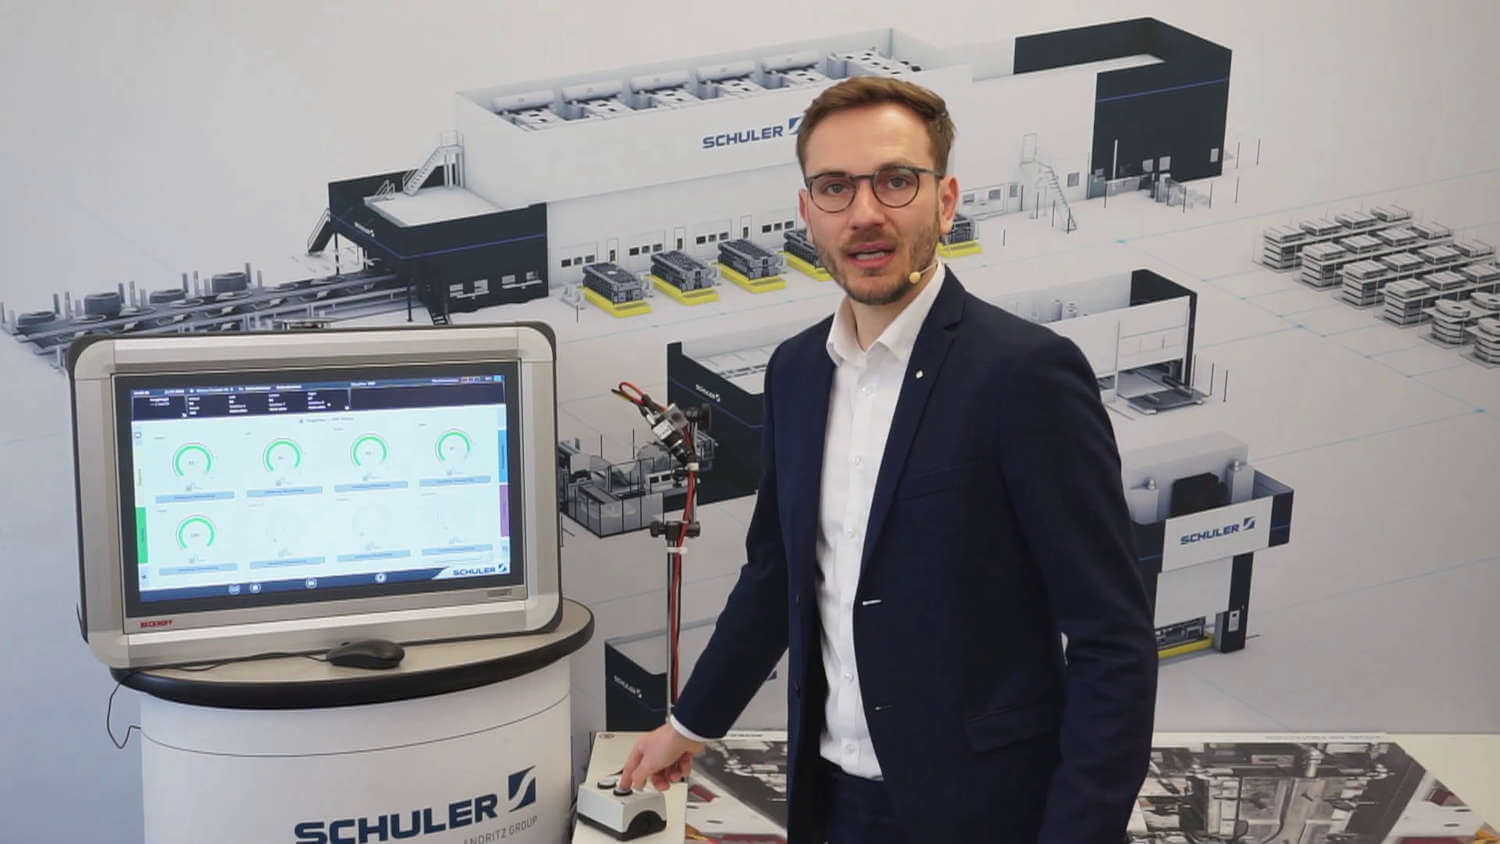
Demonstration in the Innovation TechCenter
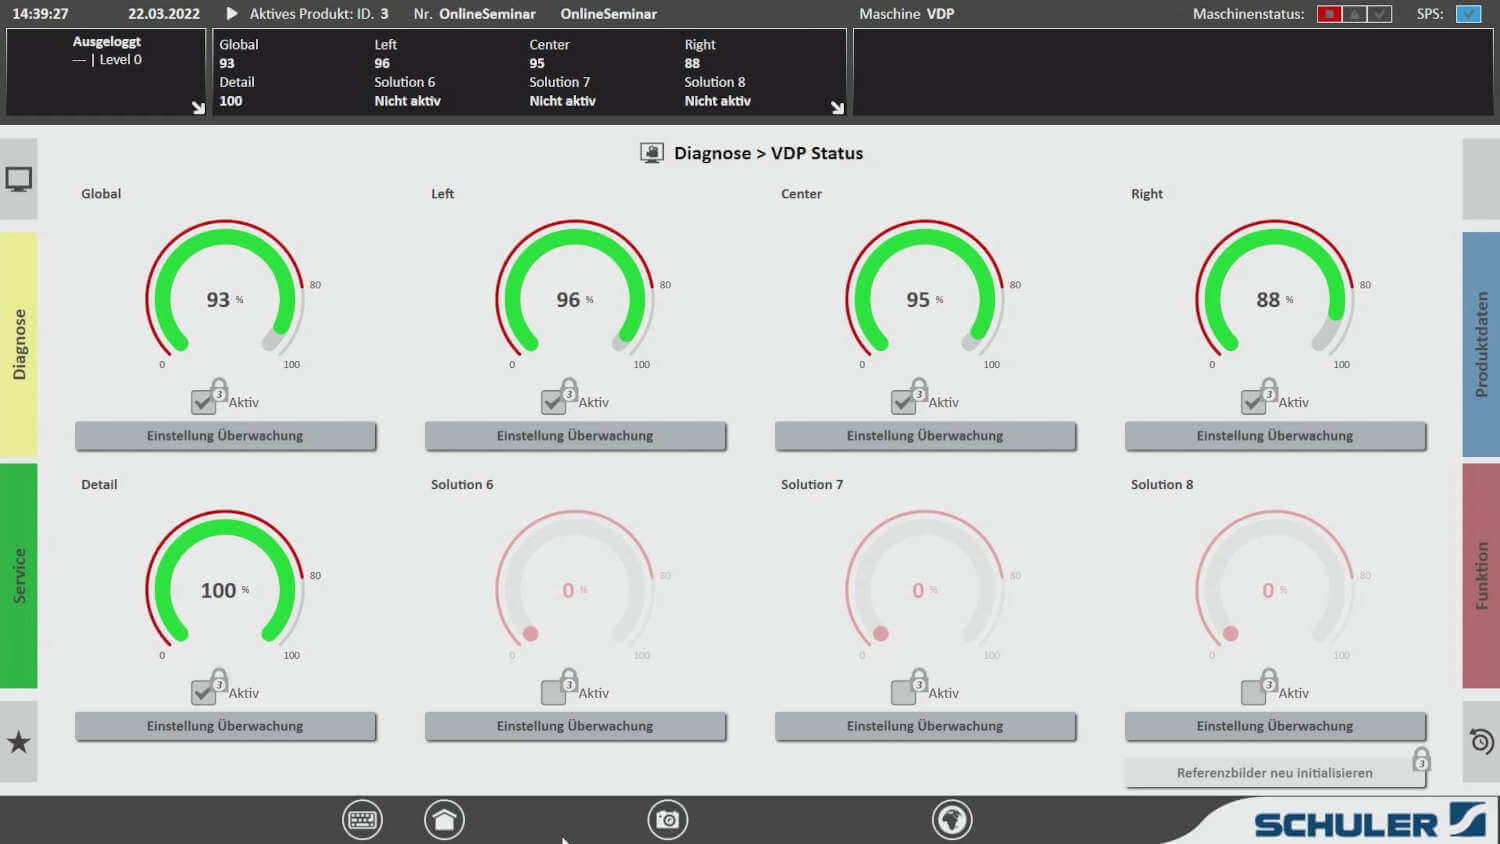
The product manager demonstrated the system at a test station in the Innovation TechCenter. The visualization system displays a total of eight so-called tacho diagrams that indicate the monitoring result in a particular area, from the complete die right down to a single centering pin. The calculated value varies up to a maximum of 100 percent depending on the deviation from a previously captured required state: The higher the value, the greater the correspondence – i.e. everything is OK. If the value falls below a certain threshold, however, a response is triggered.
System Highlights Foreign Bodies in the Visualization System
To simulate this case, he used a small screw which he placed in the simulated die at the test station. Immediately after starting the virtual press the system stopped it again, and, after clicking on one of the two red-lit diagrams on the monitor, highlighted the area in which the foreign body was located. “All parameters and reference images can be saved,” adds Pölzl. “The next time you change the die, you only need to load the product data record.”
The VDP Analyzer extends the system and provides access to historical image series and data for a detailed analysis of production. This is intended to contribute to the continuous improvement of processes and avoidance of faults. “Let us assume that something happened during the night shift and you come into the office in the morning and would like to know exactly what happened”, explained the product manager Pölzl and pointed to the visualization system: Here, one can see where the blue line – which represents the hit rate – falls below the threshold and turns into a red line when the deviation occurred. The operator now only needs to click on the image captured at that point in time to determine exactly where the problem was. He doesn’t even have to be standing next to the press: the system can also be operated from an office workstation.
For more information on the company and other online seminars, visit the Schuler website.
Read about how it is in Schuler’s heaquarter in Ursula Kampmann’s article after her visit in Göppingen.
